

Does your website show a 500 error, a blank page or "There has been a critical error on this website"? Then something went wrong in its code. The error log tells you what. It lists errors with the date and time, and often the exact file and line. You find it in DirectAdmin.
Open the error log
To open DirectAdmin, go to Dashboard, select your plan, and open Web hosting. Then click Log in automatically.
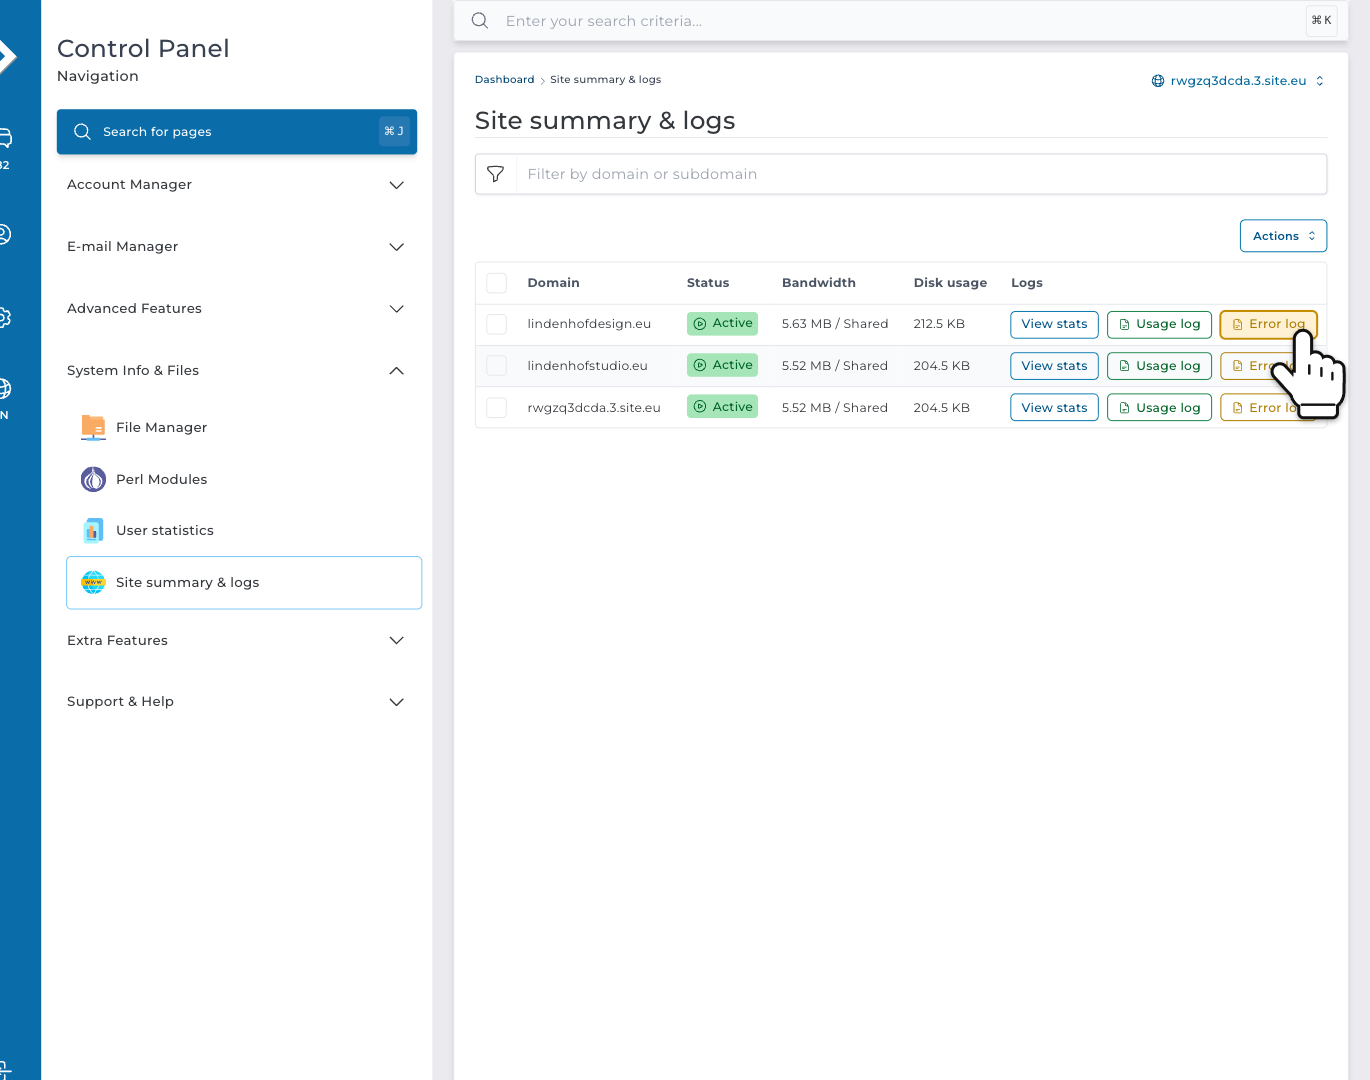
Step 1: In DirectAdmin, open System Info & Files in the menu and click Site summary & logs. Next to your domain name, click Error log.
Step 2: You now see the last 100 lines of the error log. The newest line is at the bottom. Need more lines? Enter a bigger number under Tail size (lines) and click RELOAD LOG. Or click Full log.
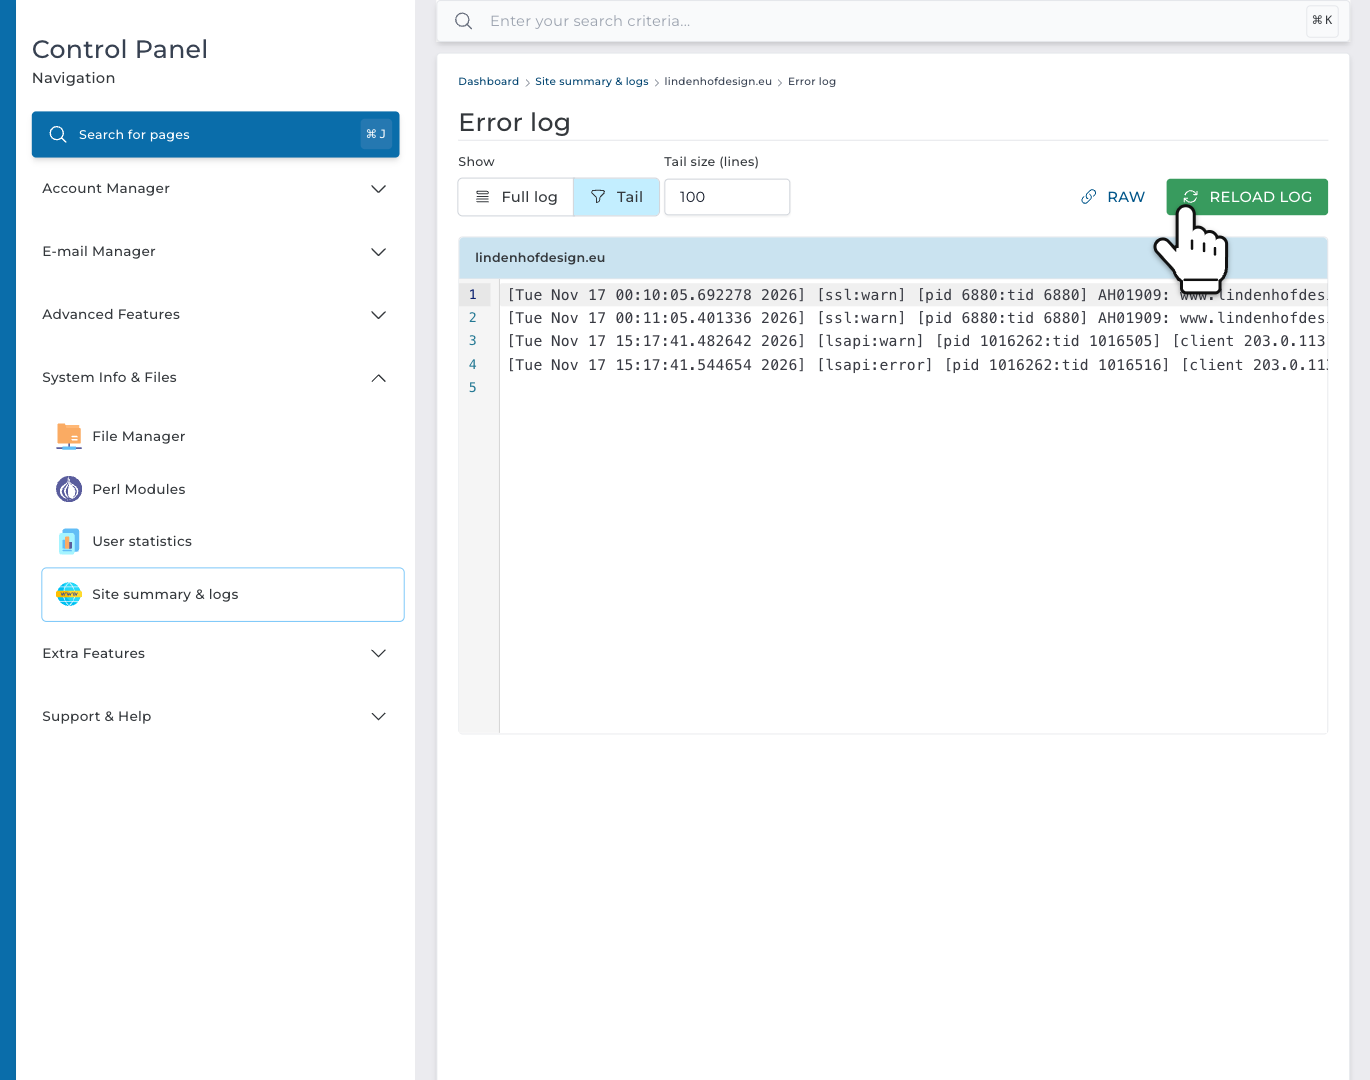
Tip: open the broken page once more, right before you look. Then your error is at the bottom. Check the time at the start of the line to be sure.
Lines are often long and run off to the right. Scroll sideways, or click RAW to see the log as plain text.
How to read the error log
Every line starts with the date and time. Then comes the message. A PHP error, for example from a WordPress plugin, ends like this:
PHP Fatal error: Uncaught Error: Call to undefined function example_function() in /home/username/domains/yourdomain.com/public_html/wp-content/plugins/example-plugin/example-plugin.php:12- PHP Fatal error: the code stopped here. This is the error that breaks your page.
- PHP Warning, PHP Notice or PHP Deprecated: something isn't quite right, but the page goes on. These are rarely the cause of a broken page.
- The path: where it went wrong. After wp-content/plugins/ comes the name of the plugin. After wp-content/themes/ comes your theme.
- The number at the end: the line in that file.
WordPress: turn on the debug log
Nothing useful in the error log? Then let WordPress write its own log. You turn it on in the file wp-config.php. It's in the folder where WordPress is installed. Usually that's public_html, or a folder in it.
Step 3: In DirectAdmin, open System Info & Files and click File Manager. Go to domains, then your domain name, then public_html. Tick wp-config.php and click Edit.
Step 4: Find the line with WP_DEBUG, for example define( 'WP_DEBUG', false );. Replace it with these three lines, and click Save.
define( 'WP_DEBUG', true );
define( 'WP_DEBUG_LOG', true );
define( 'WP_DEBUG_DISPLAY', false );
Step 5: Open the broken page again. WordPress now writes its errors to the file debug.log, in the wp-content folder. Open it in File Manager. The newest lines are at the bottom.
Done? Turn it off again. Replace the three lines with define( 'WP_DEBUG', false ); and delete debug.log. Anyone who knows its address can open that file. And it keeps growing.
WordPress may also email the website's admin address about a critical error. That email has details about the error and a link to log in to WordPress in recovery mode.
Common causes and what to do
- A plugin or theme, often right after an update. The path in the error shows which one. Update it, or turn it off. Can't log in to WordPress? Then rename the plugin's folder in File Manager, for example from example-plugin to example-plugin-off. WordPress then turns the plugin off.
- The PHP version. Old code may not work on a newer PHP version, and new code may need a newer one. Did the error start after you changed PHP? Then read how to change your website's PHP version.
- Out of memory. The error says "Allowed memory size of … bytes exhausted". Then raise memory_limit, for example to 256M. You do that the same way as in increase the PHP upload limit.
- A mistake in .htaccess. One wrong line can give a 500 error on every page. The error log then often names the .htaccess file, for example with "Invalid command". Undo your last change.
- A 503 error? That's something else: your website hits a limit of your web hosting. Read why your website gives a 503 error.
- Files or code you didn't add? Your website may be hacked. Read what to do when your WordPress website is hacked.